Security Industry Authority
Featured
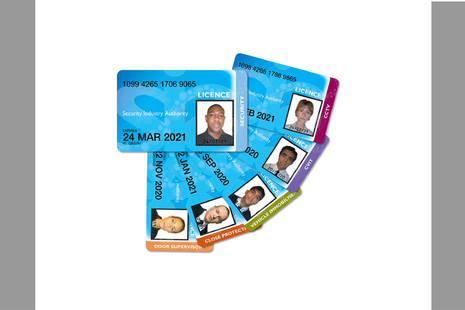
How to get an SIA licence
Collection
How to apply for an SIA licence so that you can work in the private security industry.
How to become an SIA approved contractor
Collection
How to get your company approved by the Security Industry Authority.

Learn how we enforce SIA regulation
Guidance
SIA regulation: how the SIA enforces the law and what the penalties are for breaking it.

What the changes are, when they will happen, and how they affect SIA licence applicants and licence holders.

Reporting training malpractice: who to tell and what they need to know.
Report security staff or companies you think are breaking the law

Latest from the Security Industry Authority
What we do
We are the regulator of the UK’s private security industry.
SIA is an executive non-departmental public body, sponsored by the Home Office.
Follow us
Documents
Transparency and freedom of information releases
Our management


Contact SIA
Security Industry Authority
London
E14 1UG
United Kingdom
Business support line
0300 123 9298
Licence applicants and licence holders: please contact us through your SIA online account or our contact form (link above).
Make an FOI request
- Read about the Freedom of Information (FOI) Act and how to make a request.
- Check our previous releases to see if we’ve already answered your question.
- Make a new request by contacting us using the details below.
Freedom of Information requests
Please choose 'General Enquiry' as the category, and 'Freedom of Information' as the topic.
You need to give us your full name (first name, surname/family name and any middle names) and a contact email or postal address so we can reply to you.
When you send your request, please give us as much detail as possible about the information you need.
The Freedom of Information Act gives a right of access to recorded information held by public authorities. We are not required to create new information to respond to a request, or give a judgement or opinion that is not already recorded.
If you are requesting statistical information about SIA licence holders, licence applications or our Approved Contractor Scheme, you may find the information you need in the reports we publish every month - see the 'Research and statistics' section above.
Corporate information
Jobs and contracts
Read about the types of information we routinely publish in our Publication scheme. Find out about our commitment to publishing in Welsh. Our Personal information charter explains how we treat your personal information.